Leeds United Are In Transition

After 5 years as Leeds Director of Football, everyone has an opinion on Victor Orta. Those that defend his record point to Leeds’ promotion, the wild success of the Bielsa Hail Mary, and some bargain signings along the way. To others, the expensive duds and failure to sign players in key positions make him a villain. As expected, nuance has gone AWOL, but more importantly the context around Leeds’ squad and strategy is often overlooked.

The first brief after taking over was to build a squad to get Leeds United out of the division, and quickly. The squad he inherited had a healthy age profile, with some quality in their early-mid peak or just about to come into it (Jansson, Dallas, Ayling, Wood, Cooper & Roofe). Alongside that, there were some young players who seemed to have the potential to make it at this level, in Phillips, Mowatt, Coyle and Vieira. Pablo & Berardi make up the rest of the core of what could be considered a top 6 Championship team. 

All in all, a solid core of 12 to build around but lacking in quality in depth, somewhat unbalanced and Leeds being in the Championship were in need of selling 1 top asset per year to balance the books & allow themselves to increase the wage bill in search of promotion.

Fast forward 3 years, mission accomplished. Wood, Roofe and Vieira have been sold for financial reasons, Lewie Coyle & Mowatt never made the step up to Leeds’ first team while Pontus was shipped out at Bielsa’s behest. The remaining 6, with the exception of Phillips, are now in the 2nd half of their peak and have been supplemented with Klich, Douglas, Alioski and Forshaw in similar age ranges. Leeds United are back in the Premier League, and in need of a complete rebuild in the next 4 years.

The amount of squad turnover required in the Premier League can be seen easily from the age profile above. The core of the squad is 27 & above, and there’s little coming in behind. Only 4 players are aged 21-26 at the start of the promotion season, and while there are a number of teenagers getting minutes, many of them won’t go on to make it at Premier League level. Almost 60% of the outfield minutes in the promotion season were from players 28 and above at the start of the first PL season – almost an entirely new squad in the next 3-4 years is required.

The strategy has revolved around 2 pillars. Supplement the squad with first-team-ready players largely in the 23-26 age range, and sweep up as much elite youth as possible. The key is to stay in the division while navigating our way through this transition. Fast forward another 3 years, and we can see the bulk of this new squad is now in place. The promotion squad has largely aged out, been sold or not made the jumps to the first team. Bamford & Harrison are the only peak age survivors, while Struijk & Meslier have established themselves in the first team. The rest is new.

What’s clear, however, is that while Leeds have done the bulk of the work in navigating this transition, it is by no means finished. As the squad has aged, the percentage of minutes being taken by peak-age players has dropped season on season. Meanwhile, we can see the proportion made up by 22-23 year olds has increased to compensate. So while Leeds have successfully navigated the bulk of their transition work, the next window of success isn’t yet open.

Where does this leave Leeds in terms of squad building? Projecting the current squad forward over the next 4 seasons (allowing post-peak contracts to expire), we can see the makings of a good squad in place.

In my view, the window for Leeds success opens in 24/25, and to get there they need 5 more additions over the next 4 windows. These are two left-backs, a right-back, a centre-midfielder and a striker replacing Dallas, Firpo, Ayling, Forshaw and Rodrigo respectively. This would leave us with the following 25-man squad for 2024/25:

Taking the long view, it’s clear to me that we should evaluate Leeds’ recruitment with the 24/25 season in mind, rather than the immediate impact on any forthcoming season. Get these 5 signings right and Leeds are in a great place, with a young, talented and well-balanced squad that can punch way above its financial muscle. Get them wrong, and the amount of work Leeds has to do increases significantly – delaying success & using valuable resources.

Front of mind should be the experience of Dan James & Firpo, two expensive failures who were both signed with the medium-term in mind. These have set the squad back by approximately £40m and two further signings required.

It would be negligent to not do enough to keep Leeds in the Premier League in the next 2 seasons, and thus ruin this opportunity. But it would also be negligent to waste valuable resources on short-term sticking plasters that will need replacing again in the next 2 years. It’s a fine balancing act, but if we stay in the division this year and the next, then Leeds are on track for success.

Calmness, Corners & The Pablo Hernandez Problem

We’ve reached the first international break and two weeks without (proper) football having had a twice weekly hit throughout August. Before the withdrawals set in, it’s time to reflect on the start that we’ve made and have a look at some of the issues that have arisen. 4 points from 5 games…sitting 21st – ready for a season long relegation battle right? Well, we know that the league table can often lie, especially so in such a small sample of games. Instead, we can get a better idea of our performances by having a look at some of the underlying stats.

To do so, we’ll delve into Ben Mayhew‘s expected goal numbers. Overall, we have expected goal totals of 5.9 for and 6.9 against, compared to our actual totals of 5 and 9 respectively. This suggests we’ve been a little unfortunate at both ends of the pitch. Even so, an expected goal difference of -1 puts us 17th in the xG table, which isn’t exactly setting the world alight or meeting Leeds’ expectations. However, when we look at the match by match breakdown, one of these things is not like the others:

QPR 1.7 (+Pen) – 0.3 Leeds
Leeds 1.1 – 1.1 Birmingham
Leeds 1.6 – 1.4 Fulham
Sheff Wed 1.3 – 1.8 Leeds
Nott’m Forest 1.4 – 1.1 Leeds

The QPR was a complete aberration. Truly, truly really bad. However, since then all the games have been relatively even. Against Birmingham and Fulham we had two even games. We were better in patches whilst the opposition dominated other parts. 1 point from these 2 games is just the cookie crumbling against us a little. The two following away games are 2 more relatively tight games, shading the Wednesday one and being shaded in the Forest one. Leaving the QPR game aside (I did some analysis of that game’s problems in this Twitter thread), there’s no need for hysteria around the club. We’re doing OK and whilst we’re not turning up and dominating teams, we are a little unfortunate to be going into the break with just 4 points given these performances. Some of the talk from fans saying that Monk must go is completely fucking nuts, in my opinion. It’s too early to judge what he’s doing and things haven’t really been that bad either.

Now we’ve all calmed down, we can look at some of the things that are going wrong, and some that are going right. On the plus side, we look a threat going forward, we’ve added a heap of attacking players to our ranks this summer and they look pretty good. Marcus Antonsson has very intelligent movement and decent technical ability. Hadi Sacko reminds me of an early Max Gradel, with great pace and skill but a lack of composure and final ball whilst Kemar Roofe has caused problems with his direct running. Pablo Hernandez introduced himself as a complete magician with his debut against Fleetwood, and has since been played out of position (more on this later). On the negatives, we are pretty darn terrible at defending set pieces. We gifted a goal 3 minutes in to QPR, and 2 more against Forest (in a game where we were otherwise the better team) all from corners. I’ll be looking into our set piece defence in more detail in another post.

The other negative has been our ditching of the 4231 formation that Monk used at Swansea and we used in pre-season and the first 2 games. Since the Birmingham game we’ve gone for a 442 formation and I think if we persevere down this route, then we’ll end up not fulfilling the potential of the squad. The home games saw Pablo Hernandez slot into the midfield 2 and whilst this was a great use of his playmaking abilities, we were left horribly exposed on the counter, like this Birmingham goal:

counter1

counter2

Oh well that’s fine I hear you say, just don’t play Hernandez in central midfield. Since the signing of Bridcutt we haven’t, but then we a different problem: missing his playmaking through the centre of the park. Against Forest we played him on the left, and failed to get the ball into advanced central areas, being consistently forced wide and crossing (which is a low % strategy). This is neatly illustrated by our touch map vs Forest (we’re attacking from right to left):

forest.jpg

Yikes, that lack of blue dots in the circled area is exactly why we need to be playing someone in the 10 position, and we have 2 good AMs at the club already in Hernandez and Mowatt, but since we’re trying to shoehorn 2 strikers into the team we play them wide or not at all. The answer my friends is to revert to the 4231 for which we have the requisite players, since that is how we planned to play when making our signings. Let me illustrate the choices for each position:

IMG_20160828_005110.jpg

Now the choices you make will depend on the game. Sometimes we’ll need our 10 to do more defensive work and so pick Mowatt ahead of Hernandez. Sometimes we’ll need pace and movement to expose immobile defenders and pick Antonsson, whilst other times we can use Wood’s height. We’re probably a winger short but if injuries hit we have enough versatility in the full backs to push one forward. We have the squad for 4231 and it provides us with both balance against the counter and solves the Pablo Hernandez problem.

I’m still optimistic about the season, we have both the best squad and best manager in years. The only thing that can screw it up is Cellino’s trigger finger, so let’s not give him any encouragement. MOT

Where Has All The Money Gone?

This is what I hear a lot from fellow Leeds fans: £6M for Cook, £3.7M for Byram, £11M for McCormack. We should be rich, right? So the logical conclusion is that Massimo is pocketing it. I don’t buy it, and we should direct our ire towards GFH when it comes to our financial mire. Let’s take a look at our finances over the past few years:

Screenshot 2016-07-29 17.28.49

A quick aside for those not familiar with footballing accounting practices. If you are, feel free to skip this bit. Firstly, EBITDA stands for earnings before interest, taxes, depreciation and amortisation and it’s a good measure of the underlying profitability of the club. Player amortisation works by applying the cost of the transfer fee over the course of a player’s contract. So if a player signs for £15M on a 5-year deal, the cost is shown at £3M in each of the next 5 seasons. Easy, right?
Profit on player sales is a little more complicated. That is calculated as the transfer fee received minus the amount that we still have left to amortise, or write down. This is easiest with an example, so imagine that we sell our £15M player after 2 years for £25M. We would amortise £3M in year 1, £3M in year 2 so we would have £9M of player value still on our books. The £20M fee – £9M value would mean it would go in the books as an £11M profit on player sales. Yeah, accounting is weird.

Under Bates we were roughly at break-even profitability. We decried him for spending money on the wrong things (like refurbishing the East Stand instead of investing in the playing squad) and that was probably a fair criticism. But when he sold the club we were in a reasonably stable position. We didn’t have any huge sales except Fabian Delph in 09/10 and the decimation of the squad in 11/12, as Howson, Johnson, Gradel and Schmeichel all left.

This all changed in the absolute shitstorm that was GFH Capital’s ownership of the club. Turnover plummeted whilst costs spiralled and the club went from one that was breaking even to one that was losing over £10M per year. Prudent financial management it was not. This is the period where the mysterious ‘other costs’ rose and the money disappeared through mismanagement or plain theft, not Cellino’s reign. It has since come back down to levels below the end of Bates’ tenure.

Now we enter the period where Cellino takes over. His first season is 14/15 and here we sold Ross McCormack for £11M but we spent a fair chunk of money too. We bought in 19 players over the course of the season including: £2.5M on Bellusci, £2M on Doukara, £700K on Sloth, £600K on Antenucci and a few at roughly half million each. We had a drastic, scattergun remodelling of our squad. The issue here isn’t that we didn’t invest in the squad, it’s that we spent the money badly, that Cellino didn’t make the small and wise investment in a proper recruitment structure that could have saved money and given us a better playing squad. Of the 19 we signed, I can call only 3 successful – Cooper, Berardi and Bamba with an argument for Silvestri as semi-successful.

The summer of 15/16 came round and once again we spent money. Wood for £3M, Dallas for £1.5M without any significant outgoings. We cleared the wage bill a fair chunk with Billy Sharp, Morison, Austin and Tonge all leaving the books and I would expect the club to move one step closer to sustainability. It was a window that left us in better shape than the end of the 13/14 season. We sold Byram in January with 6 months left on his deal, and got £3.5M for him, which almost covered the cost of the summer window. The accounts aren’t out for 15/16, but I would expect to see the wage bill come down from £20M and the underlying EBITDA move closer to zero, though still in losses.

This season, true to form, we have made another large sale to fund our transfer activity. Lewis Cook goes for £6M for 12 months left on his contract and not signing another one. Where has all this money gone? Well, some of it goes towards covering the still existing losses, but we’ve spent £3M on Roofe, £1-2M on Antonsson. To be honest, I think the squad is in better shape overall, I see it like this: Green > Silvestri, Bartley > Bellusci, Antonsson > Antenucci, Roofe > Carayol, Sacko > ‘Gap’. Yes, Cook is better than Grimes and we need another centre-back and possibly a midfielder, but I would do a straight swap of our squad at the end of 14/15 to now.

Now, I want to make it very clear that there are many ways Cellino has mismanaged the club. 6 managers in 2.5 years, the Steve Thompson affair, David Hockaday, Macron dispute, Lucy Ward, the treatment of Evans and Redfearn. I can go on. Believe me, I won’t be upset in the slightest if Cellino goes and I think his erratic nature is one of the biggest roadblocks to our progress.However, I think we need to view things in balance and understand our club finances so we can direct our anger rightfully. The £11M in legal fees and court cases is a shambles, but it doesn’t change the reality of a fundamentally unprofitable club (EBITDA excludes one-off items like legal fees) and it has meant that Cellino has had to cover higher losses by loaning the club more money. This isn’t £11M that we would have available to spent on the squad. The spiralling costs, falling turnover and disappearing money all happened under GFH, and they left the club up shit creek without a paddle. They are where we should direct the anger for the financial situation.

So, what’s the way to solve it? The answer is smart recruitment. We can go down the route of signing ‘proven’ players for the premium that demands, but in my view that wouldn’t be the way to challenge. The way to build a winning squad is to have better methods for finding the best unproven players, buying them with a view to selling a small proportion of them for a higher fee and keeping the rest to build a squad. This is the only sustainable way – we are competing with clubs where the parachute payments are equal to our entire turnover in the first year and half the division is getting a windfall of 1.5 Lewis Cook-s each year. We can’t go up by outspending out rivals, we can only go up by outsmarting them.

Which is why we should hire Ted Knutson.


15-16 Review Through The Eyes Of PEG

If you’re confused about what PEG is, you can read about it’s calculation here and in part 2 and this mini-post. It represents a team’s expected goal difference against an average team in a neutral venue.

One of the useful applications of the metric PEG is that we can see the performance level of a team at any given point, and so we can see how that changed over time. As such we get some interesting stories. So let’s gaze back at one of the weirdest seasons in Premier League history with a new lens. Firstly, those 7 teams that changed their managers, here the dotted black lines represent a change of manager, where there are two close together, that represents the spell by a caretaker (usually 1-2 games).

Aston Villa

Screenshot 2016-07-25 19.55.48

Swansea

Screenshot 2016-07-25 19.51.59

Chelsea

Screenshot 2016-07-25 19.59.01.png

Everton

Screenshot 2016-07-25 20.00.00.png

Liverpool

Screenshot 2016-07-25 20.21.52

Newcastle

Screenshot 2016-07-25 20.24.49

SunderlandScreenshot 2016-07-25 20.28.29

These split pretty neatly into two groups: those that worked, and those that didn’t (and Everton). Whilst it’s very easy to judge a sacking with hindsight, some of those look like bad decisions at the time. Garry Monk’s sacking from the Swansea job looks one that id driven much more by variance than performance, as his Swansea team were roughly at the same PEG level as the season start – a level they rarely reached for the rest of the season. Tim Sherwood’s sacking from Aston Villa goes it the same category, as little improvement was seen under either Remi Garde or Eric Black – although we should note their complete giving up at football after Christmas. Chelsea were the other team to show little improvement after sacking their manager, although I imagine this has much the choice of replacement in Guus Hiddink. Chelsea had clearly dropped from their title winning season to a PEG of ~0.4, which translates to a ~62 point season level. In that context Mourinho’s sacking was deserved, and given the league table at the time, Hiddink’s appointment and mediocre performance isn’t disastrous.

On the other hand, there are three managerial changes that provided clear improvements in performance. Two of these took a little time. Allardyce’s appointment at Sunderland took a little time to improve performance level, but after Christmas they showed clear improvement. The same story is true of Liverpool as Klopp’s ideas started to settle in, Liverpool started to turn in some very impressive performances, whilst their end of season drop off is largely due to playing their 2nd team and prioritising the Europa League. A sacking that was too little, too late was McLaren’s departure from Newcastle. Perhaps they could not have secured a managed as good as Benitez if they had let him go earlier, but it is tempting to buy into the idea that patience sent them down this season. Whilst there had been mild improvement since McLaren stopped insisting on playing 442, Newcastle comfortably played their best football under Benitez, and looked like a solid mid-table side. This last one is easy to judge with hindsight, but under McLaren Newcastle hovered around a -0.45 PEG which translates to a ~40 point season that is almost certainly below Newcastle’s expectations. Finally Everton, who had a weird season. They seemed to be playing good, upper mid-table football for the first 2/3 of the season, often without picking up the points to go along with it. They they stopped for reasons I can’t explain, and Martinez’s sacking in game 37 was almost certainly justified.

Next, let’s take a look at the teams that were touted to be title contenders at various points in the season – the final top 4 (click to enlarge):top4peg.png

Here we can again split these teams into two groups who followed very similar trajectories. The early season contenders, Arsenal and Man City, both had flying starts and dominated the first third of the season. They both suffered injuries and with a lack of squad depth never reached those early season heights again. City’s title bid faltered before Arsenal’s, but both were trying to hang on to an early season lead with less than stellar performances. By way of complete contrast, Leicester and Spurs improved throughout the season, both playing their best football in the final parts of the season. Leicester rode conversion percentages early on to pick up points without performances, but by the final third through a combination of their relative lack for games and settled first XI were dominant down the home stretch of their title run. Pochettino’s Spurs were consistently good throughout the season, and win the PEG award of most improved team. If it weren’t for early season draws and some early Leicester luck we could easily be toasting this past season as the weird one where Tottenham won the title.

Crystal Palace and Watford both had pretty dreadful second halves of the season, with a seeming collapse around christmas. However, a quick examination of their PEG tells a different story:

Screenshot 2016-07-26 18.26.02

Screenshot 2016-07-26 18.33.03

Palace’s collapse in performance came earlier than the results, with the drop off almost entirely complete by game 13 – after which they went on a 6 game unbeaten streak. The warning signs were all in place for a Palace downturn in results by game 19, and sure enough they went W0 D2 L9 after that. Watford on the other hand, tell the opposite story. Here, their performance level was maintained despite a streak of W1 D1 L5 from game 19-25. Largely this is because it accounts for opposition strength, and that steak included Tottenham twice, City and Chelsea. But, sure enough Watford stopped playing football in the last 11 games when they had all but guaranteed their survival with 37 points from the first 27.

One of my favourite features of the season was Man Utd having an undercover agent sent in to destroy them as their manager. Through his combination of ineffective football and consistent trolling of Man U fans it made it one of the most memorable seasons for a while. PEG agrees they were terrible, and they scraped home 6/9 wins in the closing stages despite some terrible performances. It fills me with glee that PEG now sees they as a slightly below average team in the Premier League, with a negative rating (and sitting behind Newcastle). This emphasises how much of a rebuilding job Mourinho has, and I think talk of Man Utd winning the title is wide of the mark. This trajectory sits in contrast to their close rivals, West Ham and Southampton:

Screenshot 2016-07-26 18.30.29.png

Screenshot 2016-07-26 18.27.39

Screenshot 2016-07-26 18.28.39

Southampton and West Ham looked for most of the season like most people expected them to be. In an interesting turn of timing, Joel’s “West Ham aren’t as good as you think they are” video came at game 10, the end of their early season peak. Largely it was a fair comment, although they showed clear improvement in the second half of the season and look to be making true progress under Bilic. Southampton looked to be a slightly worse version of 14-15 Southampton, as they never quite hit the heights they saw 2 years previously under Pochettino. Seemingly, they discovered how to play football in the last few games of the season, sneaking in to snatch 6th place.

Finally, we have the remaining 4 teams: Stoke, West Brom, Norwich and Bournemouth:

Screenshot 2016-07-26 18.34.34

Screenshot 2016-07-26 18.31.50

Screenshot 2016-07-26 18.31.09

Screenshot 2016-07-26 18.29.33

Since these were the teams I couldn’t neatly group into narratives and this article has already rambled on for longer than I thought I’ll sum these four up in a line or two.

Stoke: PEG really doesn’t like Stoke by the end of the season – only Villa are worse. They have fluctuated between relegation fodder and mid-table mediocrity. Stokelona they were not.

West Brom: This has Pulis written all over it.

Norwich: Consistently and steadily shite, but probably not as shite as we thought.

Bournemouth: Took a while to adjust to Premier League football, especially with injuries to key attacking players. They showed second half of the season improvement and will only do better next year with the addition of the world’s best midfielder.

That’s all for now folks.

PEG – Optimising K

In part 2 of PEG I wrote briefly about choosing a k value. I chose it pretty much on a hunch, that some level of stability is good, so that the metric isn’t just blowing with the wind. Alongside that, I wanted to pick the k that made end of season values roughly immune to the starting point, on the hunch that performances from over a season ago wouldn’t tell us much about future performance. Ben Torvaney (@Torvaney) had the great suggestion that I should test different k values and choose the one with the best predictive power, and I did. So here’s a quick mini-post run down.

So, I looked at three metrics: the number of correct results predicted, the mean average error in predicted goal difference and the betting profit/loss over the course of the season. I looked at these both with actual results and the expected goals ‘results’. The curious thing is that it really depends on whether you want to optimise to predict future results, or future expected goals. Let’s have a look:

Screenshot 2016-07-22 13.39.04.png

Screenshot 2016-07-22 13.40.01.png

Screenshot 2016-07-22 13.40.46.png

Looking at those three together, it seems that for predicting future results the optimal k is somewhere from 0.09-0.14, whilst for predicting future expected goals the optimal k is 0.05-0.1. Taking those together, a sensible compromise seems somewhere in the region of to be k=0.09.

PEG (formerly xxG) Part 2

As always I should start with the credits. After I introduced this metric, I asked for better name suggestions than ‘expected expected goals’ and got many great suggestions, so thank you all. In the end I plumped for PEG (projected expected goals) and the credit to that one should go to Tom Worville (@Worville). Secondly, thanks for the comments and questions – they help to clarify my thinking and hopefully improve the metric. Finally, once again, thank you to Michael Caley (@MC_of_A) for publishing his expected goals numbers publicly and without whom this metric would not exist.

One of the problems that I had when publishing these figures is that because I only had match by match xG totals for the 15/16 season, I had to start each team at 0. This meant that we couldn’t do lots of cool stuff like looking at how the PEG rating of a team changed over the course of last season. We couldn’t investigate the impact of new managers using this metric. It meant we had to wait until next year. No longer! It’s a little bit of a fudge but I stumbled upon the expected goal totals for the 14/15 season (again, thanks to Caley!). This means we can use the average expected goal difference as the starting value for PEG, and investigate some interesting stories, like this one about Swansea (maybe sacking Garry Monk was a mistake, not that I’m complaining as a Leeds fan):

Screenshot 2016-07-21 15.53.08

Secondly, we need to discuss the k-value (sensitivity) of PEG, in the graph above I’ve used k=0.075. Here, I’m trying to choose the lowest value that lets the end of season PEG to be relatively immune to the start of season PEG. This is because I’m unconvinced that information from more than a season ago is going to tell you much about future performance. So I tried three different sets of starting values – zero for all teams, the 14/15 average expected goals and the 15/16 expected goals. The lowest value where the end of season values converge to a large degree is k=0.075. This is the table showing final ratings and their sensitivity to starting values with k=0.075:

Screenshot 2016-07-21 17.40.31

Finally, I want to answer a quick question about the predictive power of this metric. Firstly, we can look at the correlation between the pre-match PEG and both the actual goal difference and match expected goal difference:

Screenshot 2016-07-21 17.20.34
Screenshot 2016-07-21 17.19.32

To be honest, I’m not really sure how to interpret those R² values, but at least the direction is how we would expect. I think it is probably more illustrative to look at the number of games predicted correctly, and how well we did compared to odds. I took a PEG prediction as follows: anything greater than 0.25 was win for that team, the rest were considered draws. The number 0.25 comes from looking at the average number of draws from 05/06 to 14/15 (95) and choosing the PEG value that gives ~the expected number of draws. It predicted 178/380 results correctly, and would have made a £175 profit (on best odds, drops to £165 if I just use Bet365) by staking £1 on each game (46% ROI!). Caution abound since we only have one season of data, and that is not enough to draw conclusions, but I’ll be keeping track of this over the coming season.

Correction: I put the formula in wrong, it actual comes out about evens (£3.48 loss) against betting odds. With some k-values it makes a profit, mini-post coming later on optimising k. Dang, I knew it was too good to be true.

Where it comes to predicting the expected goals result, it does slightly better, as you would expect. I coded anything with a 0.3xG gap or smaller as a draw, and anything else as a win/loss and here PEG predicted 215/380 results correct. Not bad! I can’t tell you anything about it’s predictive power on a seasonal level, but we will know a little more in 12 months time.

So that’s part 2. If you keep an eye on my Twitter then I will be posting the stories of last season according to PEG. Until next time!

Introducing Expected Expected Goals (xxG)

Before I start I want to thank Michael Caley for the excellent work done on expected goals. He publishes xG numbers game by game each week and without this, this work would not have been possible. If you don’t already, follow him.

Often, as a quick proxy for team strength we take a quick glance at the season long expected goal difference (or ratio). Whilst useful, this simple sum/ratio conceals some useful information. Take a look at this chart for Arsenal (up to game 37):

Screenshot 2016-07-04 21.59.43.png

We can see that in the first 10 of so games they flew out of the traps, putting dominant performances, and since then they have been unable to hit those heights. Looking only at an xG sum means we would consistently see Arsenal as a better team than they have been for the rest of the season.

The other issue comes early in the season, where different clubs have had different schedules. We can adjust our interpretation of the xG sum accordingly but it is hard to quantify the effect.

Introducing xxG – expected expected goals (sorry for the crap name). It works like this. For each match, we work out what is a ‘par’ expected goal difference and then adjust each team’s rating up or down depending how they performed compared to that par score.

So: new rating = old rating + K x (match xG difference – par score), where K is the sensitivity factor.

Okay, I’m rambling so let’s just take a look at an example, the Chelsea vs Tottenham match at the end of the season, we’ll use a K value of 0.1. Before the match Chelsea have an xxG of 0.226, and Tottenham of 0.502. The par score is simply 0.226-0.502 + 0.4 (for home advantage). Giving a +0.124 par for Chelsea and vice versa for Tottenham. The actual xG score was 0.8-2.1. The new ratings are:

Chelsea: 0.226 + 0.1 x (-1.3 – 0.124) = 0.084
Tottenham: 0.502 + 0.1 x (1.3 + 0.124) = 0.644

Hopefully these read in an intuitive way, as they tell us the current ability of the team in terms of expected goal difference per match, but hopefully avoiding the two issues with a simple average.

Before I post the final ratings table, there are a couple of things to note. The first is that, because I only have data for this season, each team started the season with a rating of 0. This means it’s hard to glean the story of last season because it necessarily takes some time to give useful information. If anyone wants to send through xG totals for matches in other seasons I would be very grateful and happy to update this. For the same reason, I haven’t been able to backtest and find out a) whether this is useful or b) what the optimal K value should be – so it’s a bit of a stab in the dark, suggestions are more than welcome. Lastly, for round 38 I have used Paul Riley‘s Shot Position Average Model as a proxy for xG as Mr. Caley was rightfully mourning Tottenham’s last day collapse instead of giving us xG numbers.

So, here goes (table sorted by K = 0.05):

Screenshot 2016-07-04 22.30.46

Feedback more than welcome. Let me know on Twitter.

Footballing Clichés Are (Mostly) Wrong: A Quick Analytics Primer

This is a nowhere near exhaustive look at some of the commonly used concepts underpinning football analytics as of today. The purpose is to have a single point of reference for anyone new to the community who wishes to understand what the hell is going on with PDO, expected goals and air-conditioned offices. This is just the basics, so if you’re already familiar then you can skip to the further reading.

Repeatability as skill, flukes as luck

Despite what footballing clichés tell you, it turns out that the league table really does lie sometimes. We’ve all had enough arguments about football to agree that some portion of what goes into a team’s points total is luck. This is especially true when fewer games have been played, before the league “has settled down”. If we can separate the skill from the luck, we can better estimate a team’s true strength, and predict future outcomes more accurately. To do this, we use the idea that the more repeatable something is then the more it is down to skill (and vice versa). This is quite intuitive if you cast your minds back to playground arguments about whether your 35-yard wonder goal was a fluke, ending in being challenged to “do it again then”.

So, which things in football are repeatable?

It turns out that the chances created by a team (which we measure by looking at shots) is much more repeatable than the conversion of those chances. The same applies when we look at chances allowed, although it is less repeatable than attacking measures. You will probably hear about shots ratios a lot. The most simple is total shots ratio (TSR), although we can create similar measures by using only shots on target (SoTR) or unblocked shots (Fenwick). The advantage of a shot ratios is that they are more repeatable than looking at attack or defensive measures alone, thus less down to luck. It is the share of shots you take in your matches, and we calculate like so:

Total Shots For / (Total Shots For + Total Shots Against)

On the conversion side, we work out the scoring percentage (goals scored / shots on target taken) and save percentage (saves made / shots on target allowed). Adding these gives a stat named PDO, which confusingly doesn’t stand for anything. It is named after its inventor from ice hockey forums and it gives a measure of how well a team has converted its chances relative to the opposition. It tends to regress to the mean to a large extent. For more detail on the split between skill and luck see the further reading.

NB: As a quick aside, repeatability isn’t the whole picture. A measure for team strength is only helpful if it is both repeatable and explains real world results as well.

Further Reading
Which metrics are the most repeatable between the first 19 and final 19 games of the season? – James Grayson
How repeatable are shots on target? – James Grayson
2015/16 Main Data Table – Objective Football

Expected goals: not all shots are created the same

The most obvious hole in treating shots as equal to team strength is that all shots are treated the same. It doesn’t matter whether it is from the halfway line or a tap in. We know that not all chances are created equal and expected goals is the way of quantifying just how good those chances really were. The most detailed work I have seen is by Michael Caley and takes into account the location of the shot, body part, pass location, and much more. It’s in the further reading and I cannot recommend it highly enough. Expected goals is currently the best single value metric that we have for predicting future performance, and this is why it is so popular in the analytics community.

Further Reading
2015/16 xG MapPaul Riley
Premier League Projections and New Expected Goals MethodMichael Caley

Why the final whistle takes forever when you’re winning

We have all watched enough football to know that a 1-0 lead is a nervy one for your team, and you always seem to be under the kosh, even if you have dominated the game. It is true that teams that are leading tend to sit a little deeper and play on the counter. Teams in the lead take fewer shots but have higher conversion rates, suggesting that they are higher quality attempts than the opposition who cannot penetrate the “defensive shell”. In the end teams that are leading score more, so the first goal is important so the footballing clichés have one back in their favour.

Further Reading
Score EffectsBenjamin Pugsley
A Little Bit More On Game State Man V Metrics
What a difference a goal makes: Score effects in the 14/15 Championship – Ben Torvaney

As I said at the top this is nowhere near exhaustive, but it should be enough to get you started. If you are interested in learning more, have a browse through the sites with the linked articles. Just remember, goals are not the only stat that matters.

Murphy, Mowatt and Mirco: How 4231 Could Have Saved Uwe Rosler

Another manager sacked, making it 6 in 18 months. Was Uwe unlucky or incompetent? Leeds are sitting 18th with 11 points from 11 games, seemingly making little progress from last season, where we finished 15th. Without a win at home since March and three straight losses isn’t pretty reading by anyone’s book. However, we know that quite often goals don’t tell the whole story. On top of that, what should the target be? Our mad-hat president thinks promotion, Rosler says top 10. Avoid relegation?

Leeds were terrible last season and we were lucky to stay in the division. An article is on it’s way, but the short version is we were the 2nd worst team in the division. With that in mind, promotion is not on the cards. I think that a top half finish is a great success for the club, showing real progress from last season; setting us up well for a promotion challenge next year. Saying that, I’m very sceptical that any manager will get 2 years to mould the club and the team to their ideas. We never got the chance to see what Uwe Rosler could achieve at Leeds United, and that is the real tragedy – that we will never know what could have been and that no self-respecting coach would take a job underneath il mangia-allenatori.

Still, now he has gone, we can review the Rosler era in its entirety, and truth be told I think he was unlucky to go. To start with, let’s look at some of the basic underlying numbers for Leeds this season. We have a total shots ratio of 47.9% and a shots of target ratio of 41.9%, both compared to a league average of 50%. Our conversion is 10 goals from 36 SoT, giving us a scoring percentage of 27.8%, whilst the opposition have netted 15 goals from their 50 SoT, a save percentage of 70%. Putting those together we have a PDO (scoring % + save %) of 97.8, compared to a league average of 100.

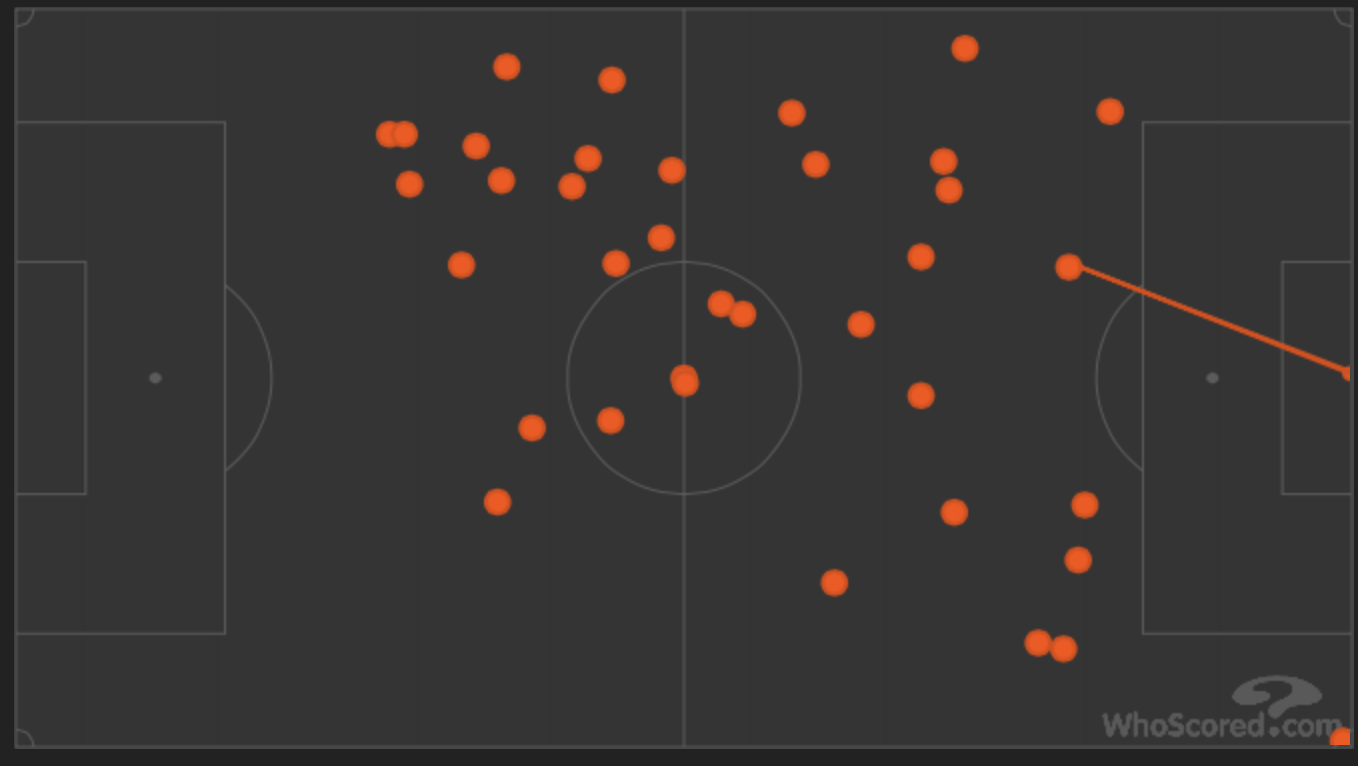
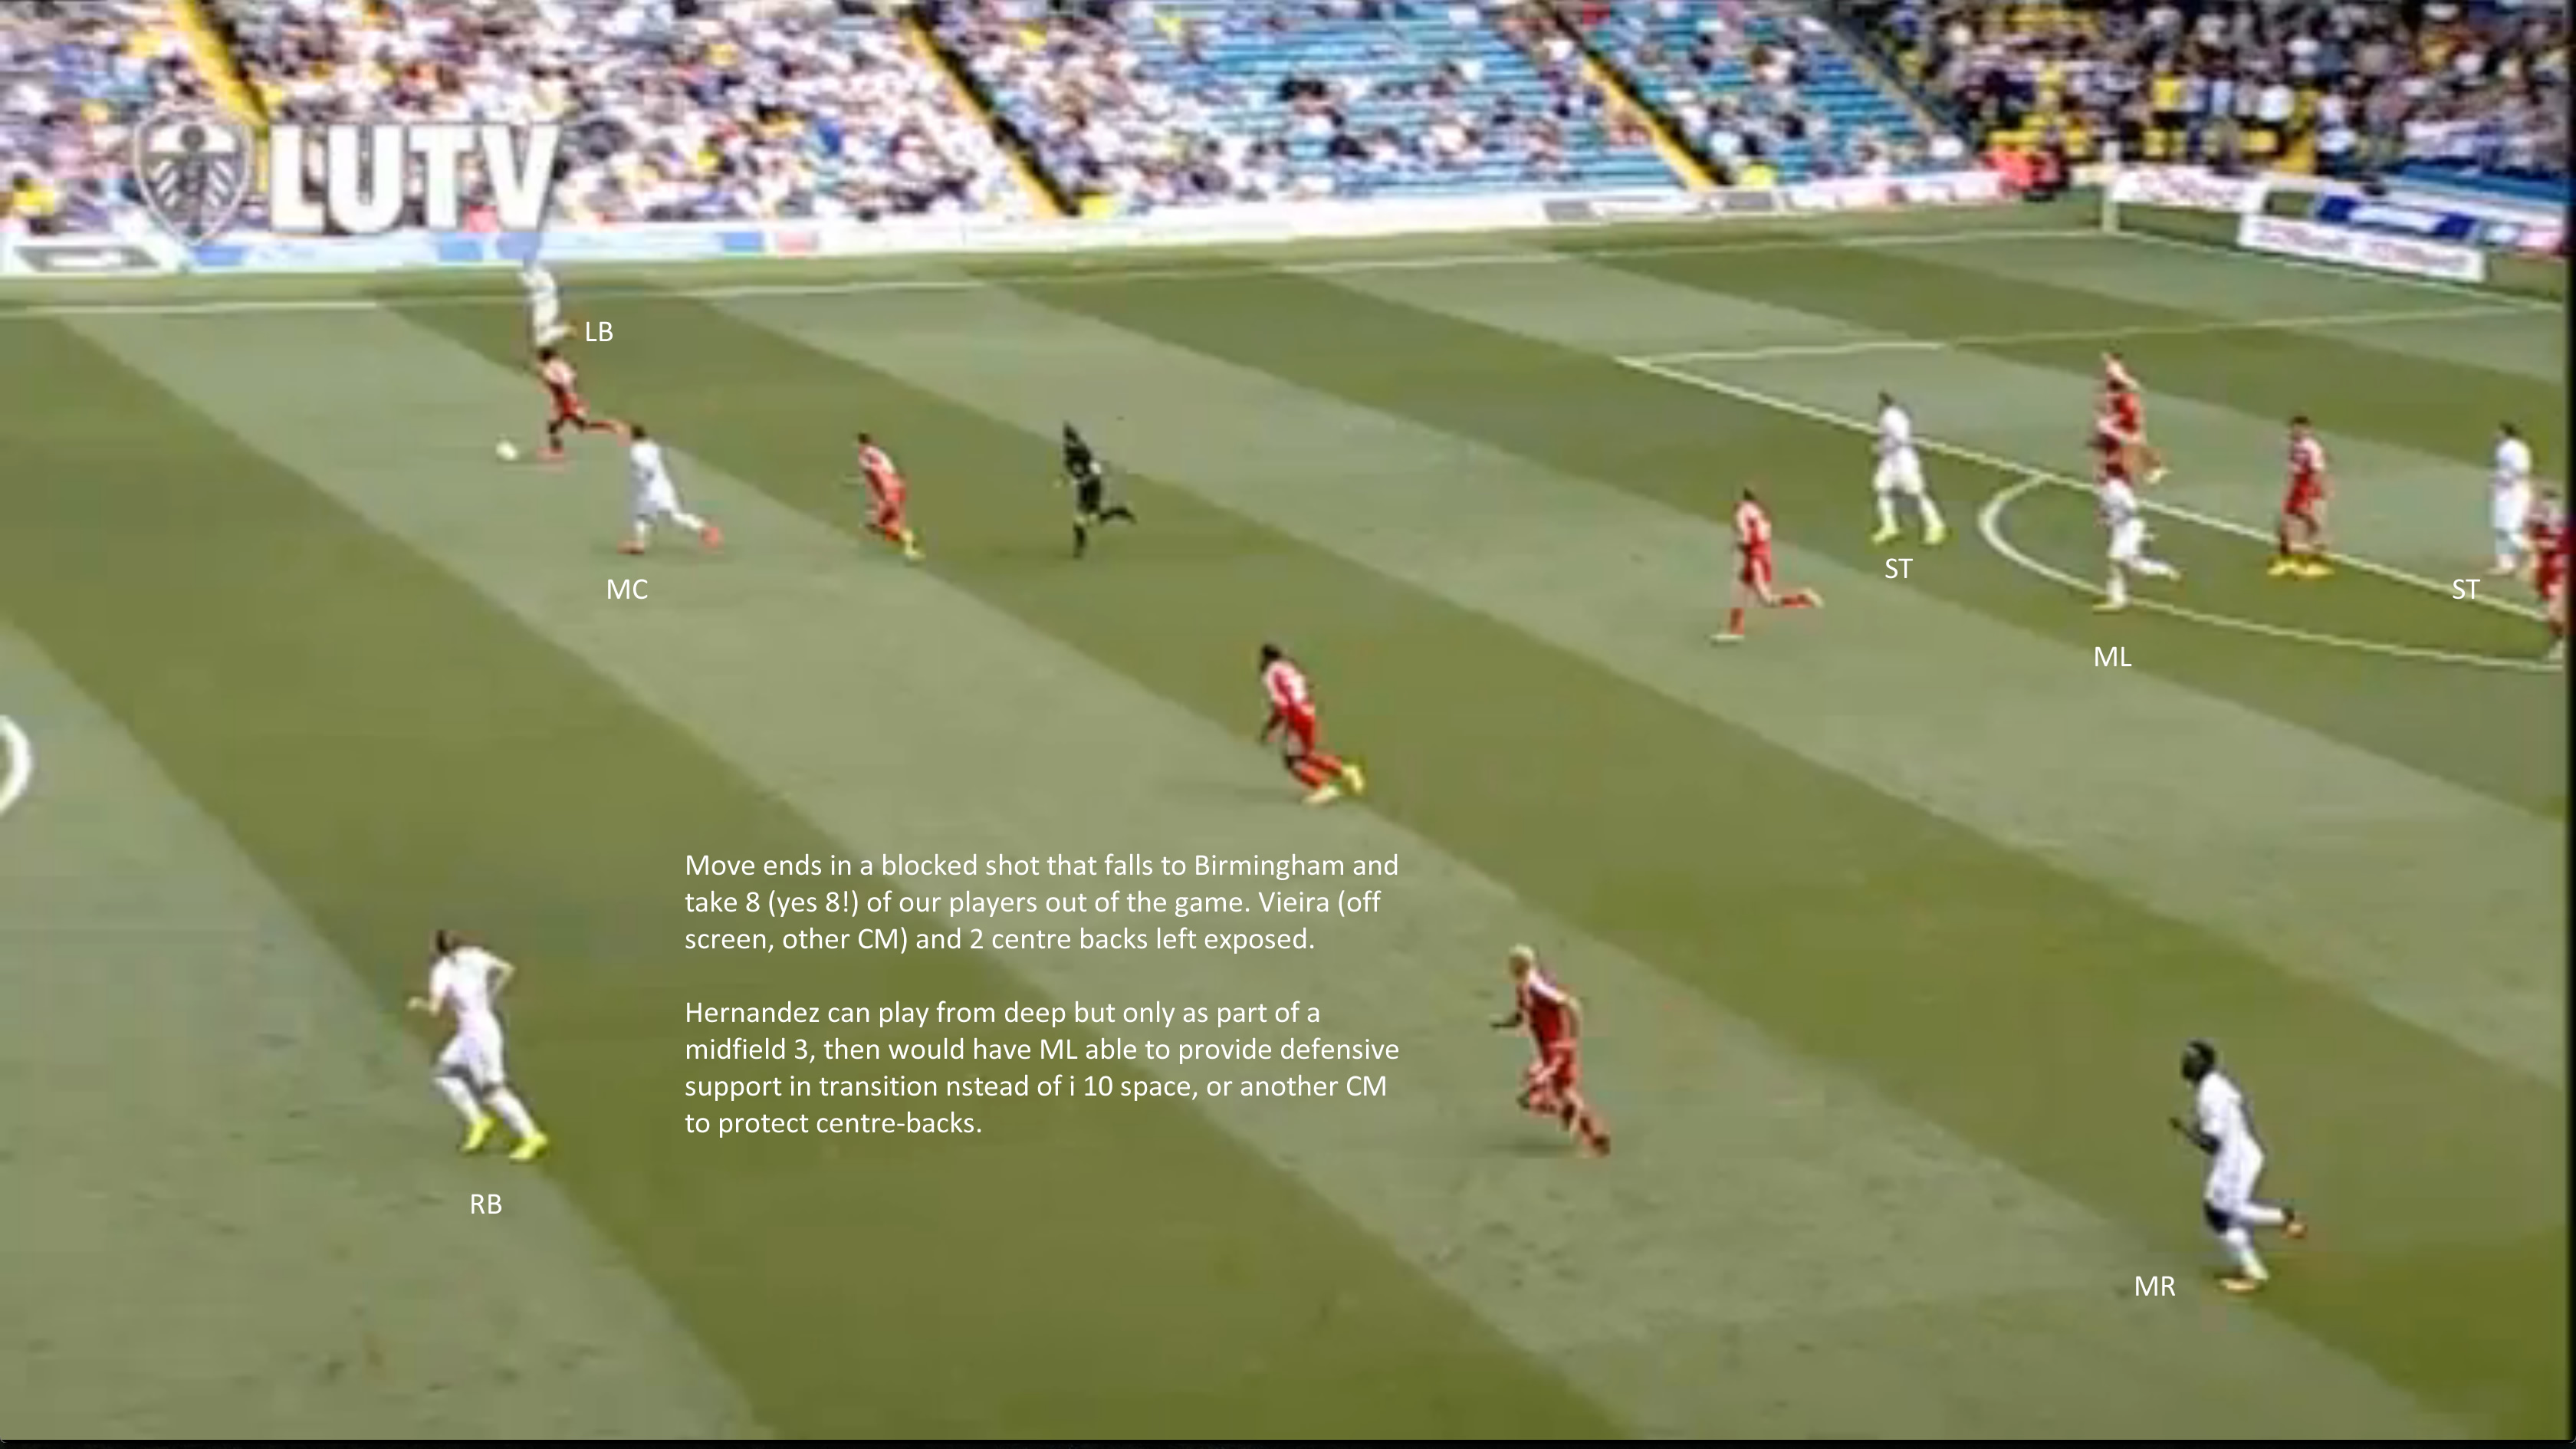
Now, what do all those numbers mean? First, we used the ratio of shots or shots on target because they tend to be more repeatable, both within a season and between seasons, than points or goals. PDO is a measure of how well we convert our shots on target into goals relative to the opposition and it is largely driven by luck. So the numbers above seem to suggest we are a slightly below average team that has been a little unlucky. Something sticks out from those 3 numbers and that is the large discrepancy between our shots and shots on target ratios. As we are using either (or both) of those ratios to measure underlying performance, the large difference between them means we need to dig a little deeper. There is another issue with shots ratios – they treat all shots as the same, whether an open goal tap in or a speculative effort from 45 yards, so let’s look at where Championship teams shoot from.

(from whoscored.com)
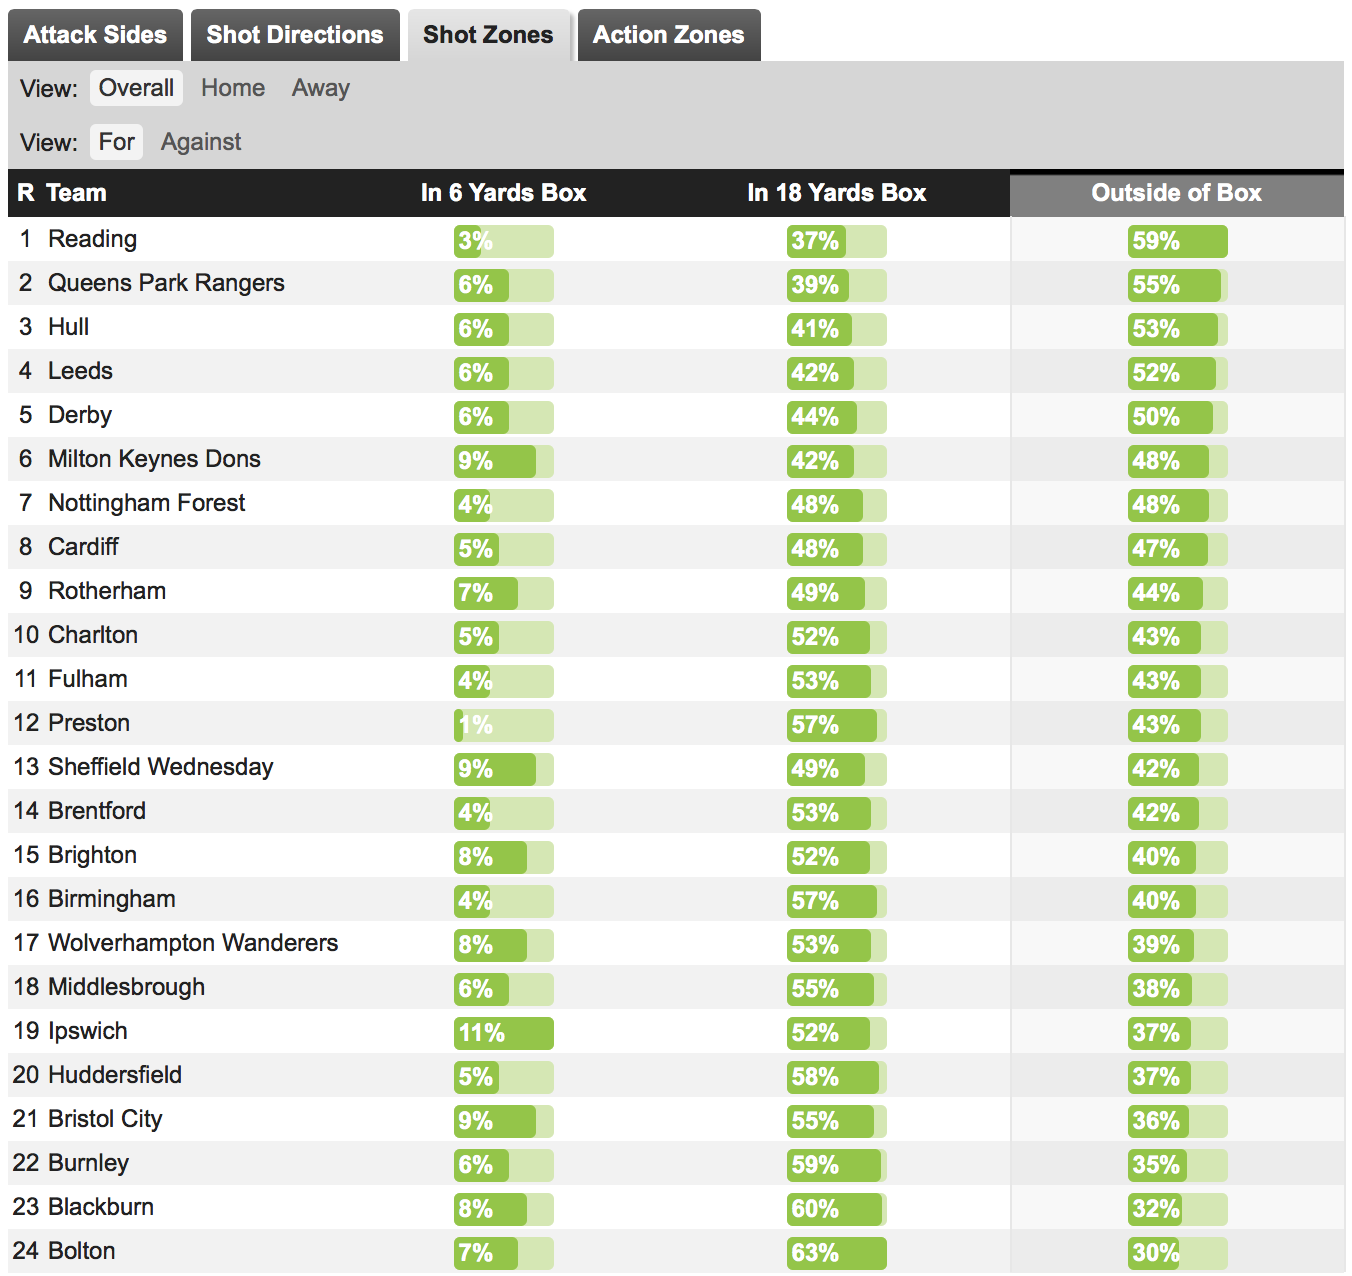
Screenshot 2015-10-19 18.47.39.png

Oh.

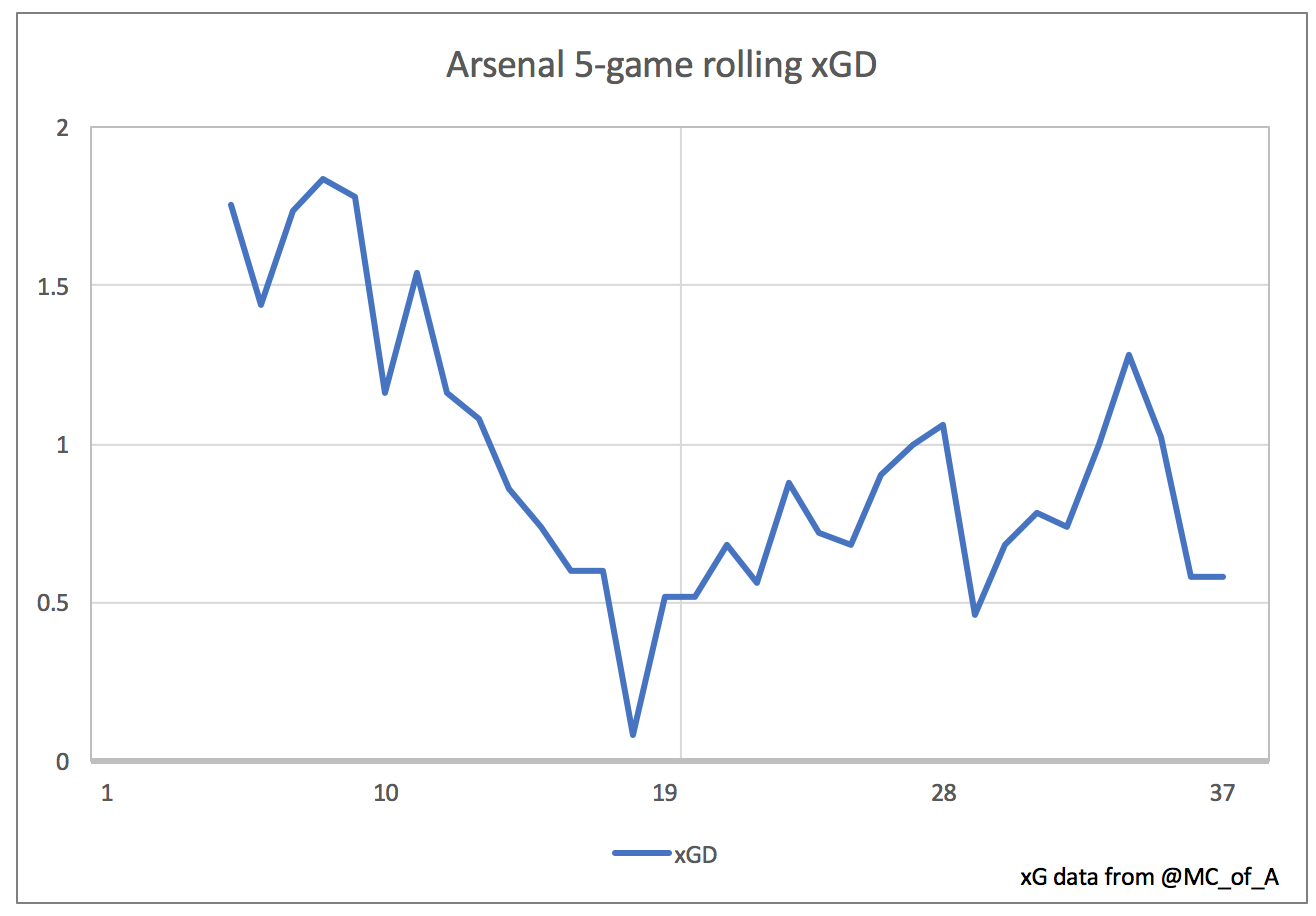
Let’s delve a little deeper into these figures. We can use a measure called expected goals, which weights shots according to how likely it is to be scored, according to its position and situation etc. For a fully detailed look at expected goals, see this work by Michael Caley. I will be using the excellent work done by Ben Mayhew at his website Experimental361 and using the expected goals numbers, it let’s us see our results in a whole new context. So, based on expected goals, here is our season so far:

Leeds 1.5 – 1.0 Burnley
Reading 0.7 – 0.9 Leeds
Bristol City 2.0 – 1.2 Leeds
Leeds 1.9 – 0.6 Sheffield Wednesday
Derby 0.9 – 0.9 Leeds
Leeds 1.2 – 1.6 Brentford
Leeds 0.5 – 1.0 Ipswich
MK Dons 2.2 – 1.6 Leeds
Middlesbrough 1.4 – 0.6 Leeds
Leeds 1.3 – 0.8 Birmingham
Leeds 1.0 – 1.4 Brighton

Taking all this together, we have an expected goals totals of 12.6 for and 13.6 against. Giving us an expected goal difference of -1. Not a spectacular record over the first 11 games, but certainly at least part of our malaise seems to be luck, having scored 10 goals and conceded 15 in real life. The numbers suggest we’re a bottom half mid-table team so far this season, which is not a sackable level of performance, after 11 games when the target is top 10. As a fan, the frustrating thing (defensive errors apart) about watching Leeds this year has been the lack of chances created. A measly 1.15 expected goals for per game has been uninspiring, and it is in a large part down to the shape of our midfield that affects the whole balance of the team.

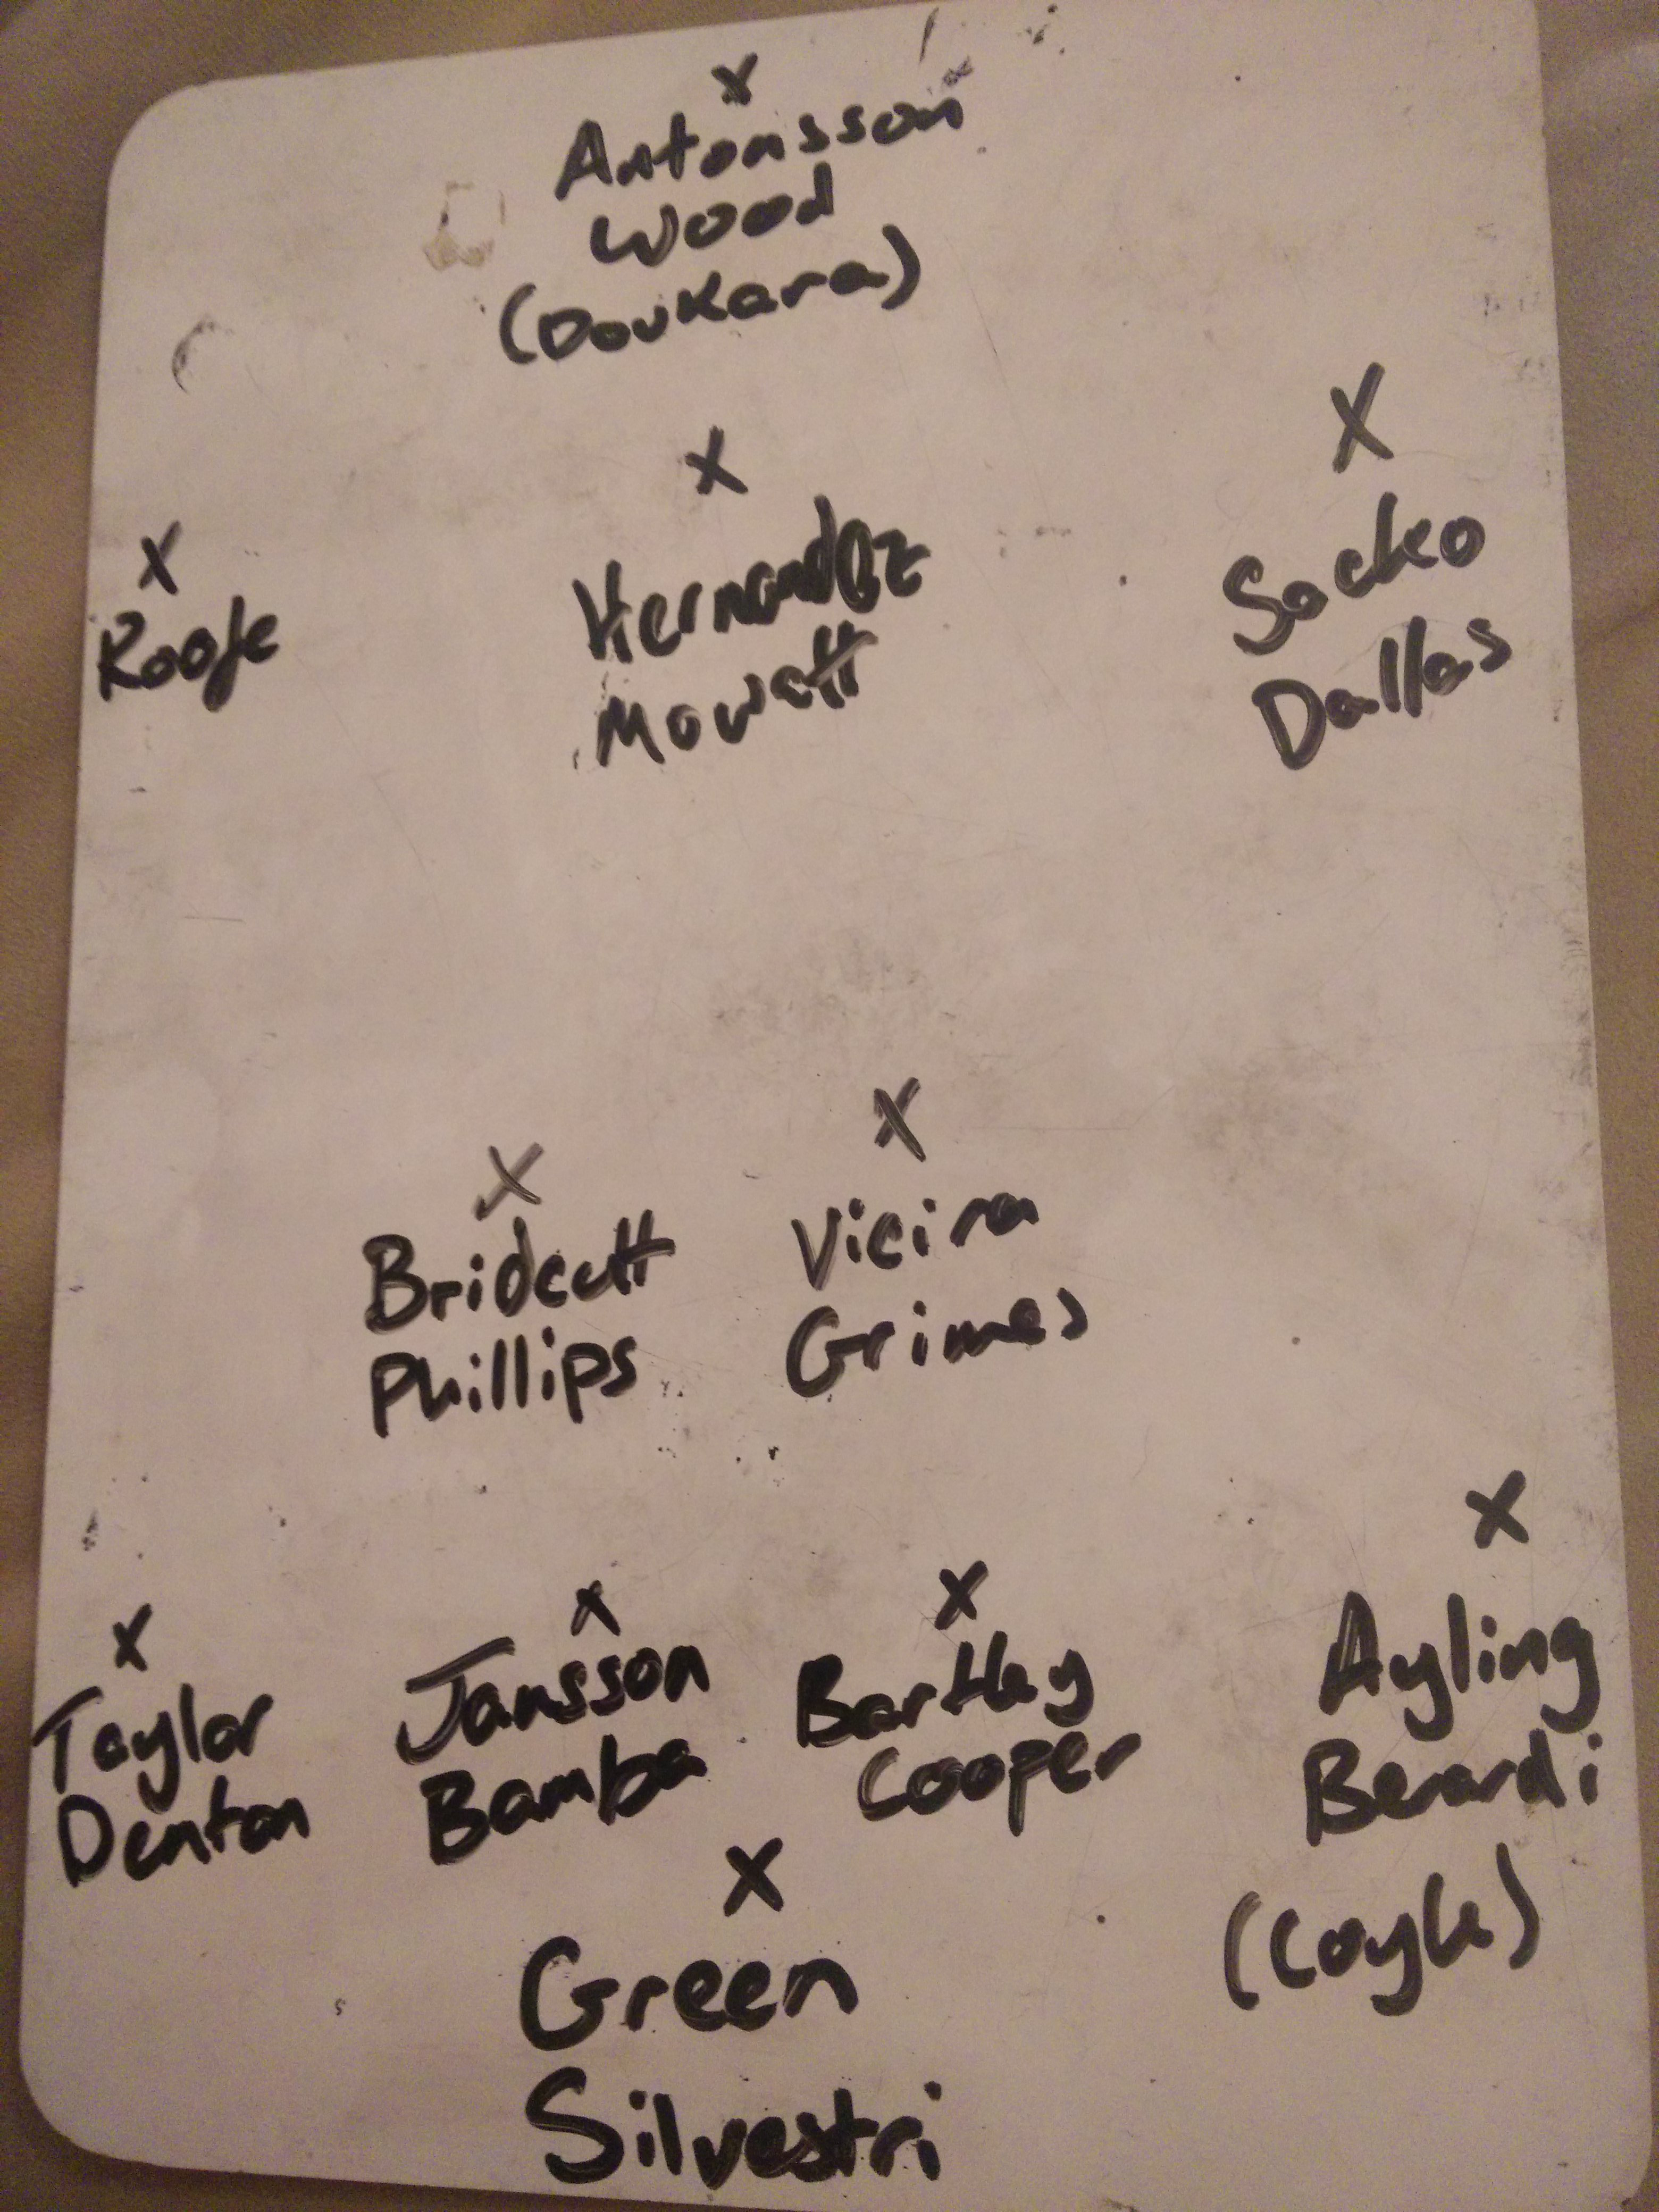
Firstly, let’s have a look at the stats for our current crop of central midfielders over the past couple of seasons (all stats per 90 minutes):

Screenshot 2015-10-19 18.47.39.png

To delve a little deeper, I’m going to use some of the excellent research done by Will Gürpınar-Morgan to look at types of player from underlying statistics. He finds that these are the types of midfielder:

Screenshot 2015-10-16 16.23.31.png
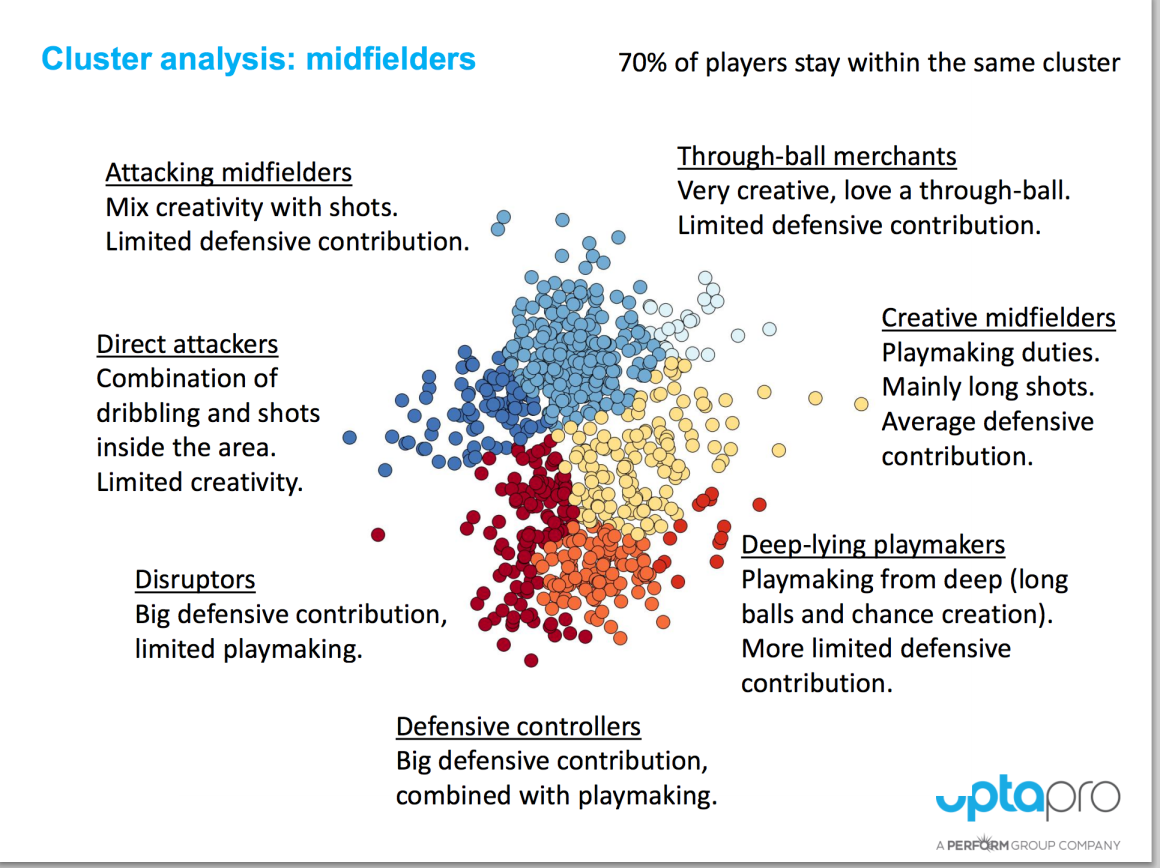
Looking at the stats above the way I would classify the 5 CMs who have been on the pitch so far this season for Leeds are as follows. Tom Adeyemi has good defensive stats and he contributes pretty much nothing going forward, he is a definite disruptor. Mowatt contributes little defensively although he has decent playmaking abilities and he loves a long shot. I’d probably place him as an Attacking Midfielder. Lewis Cook has a decent defensive contribution and clearly loves a tackle (5.6 per 90 this season). He can also create chances, dribble and shoot – the boy is special. I’d place him as a creative midfielder, although to be honest I think he has the talent to excel played as an attacking midfielder too. Luke Murphy, fits almost exactly into the deep-lying playmaker description, with lots of long balls and less work in defence. Now, I’d be wary about reading too much into Kalvin Phillips’ figures as the boy has had hardly any football. So, with the caveat that 371 minutes of football is not enough to judge a player on, he has started hugely impressively. He has excellent defensive stats but he can also ping a pass and create chances. This puts him as, possibly, just possibly the rarest of breeds, a defensive controller. I know it is very early days but surely these early performances are enough to justify more of a run in the team?

Now, with all of that in mind, let’s move onto the crux of this, the single vs double pivot (holding midfielder):

leedsmidfield.jpg

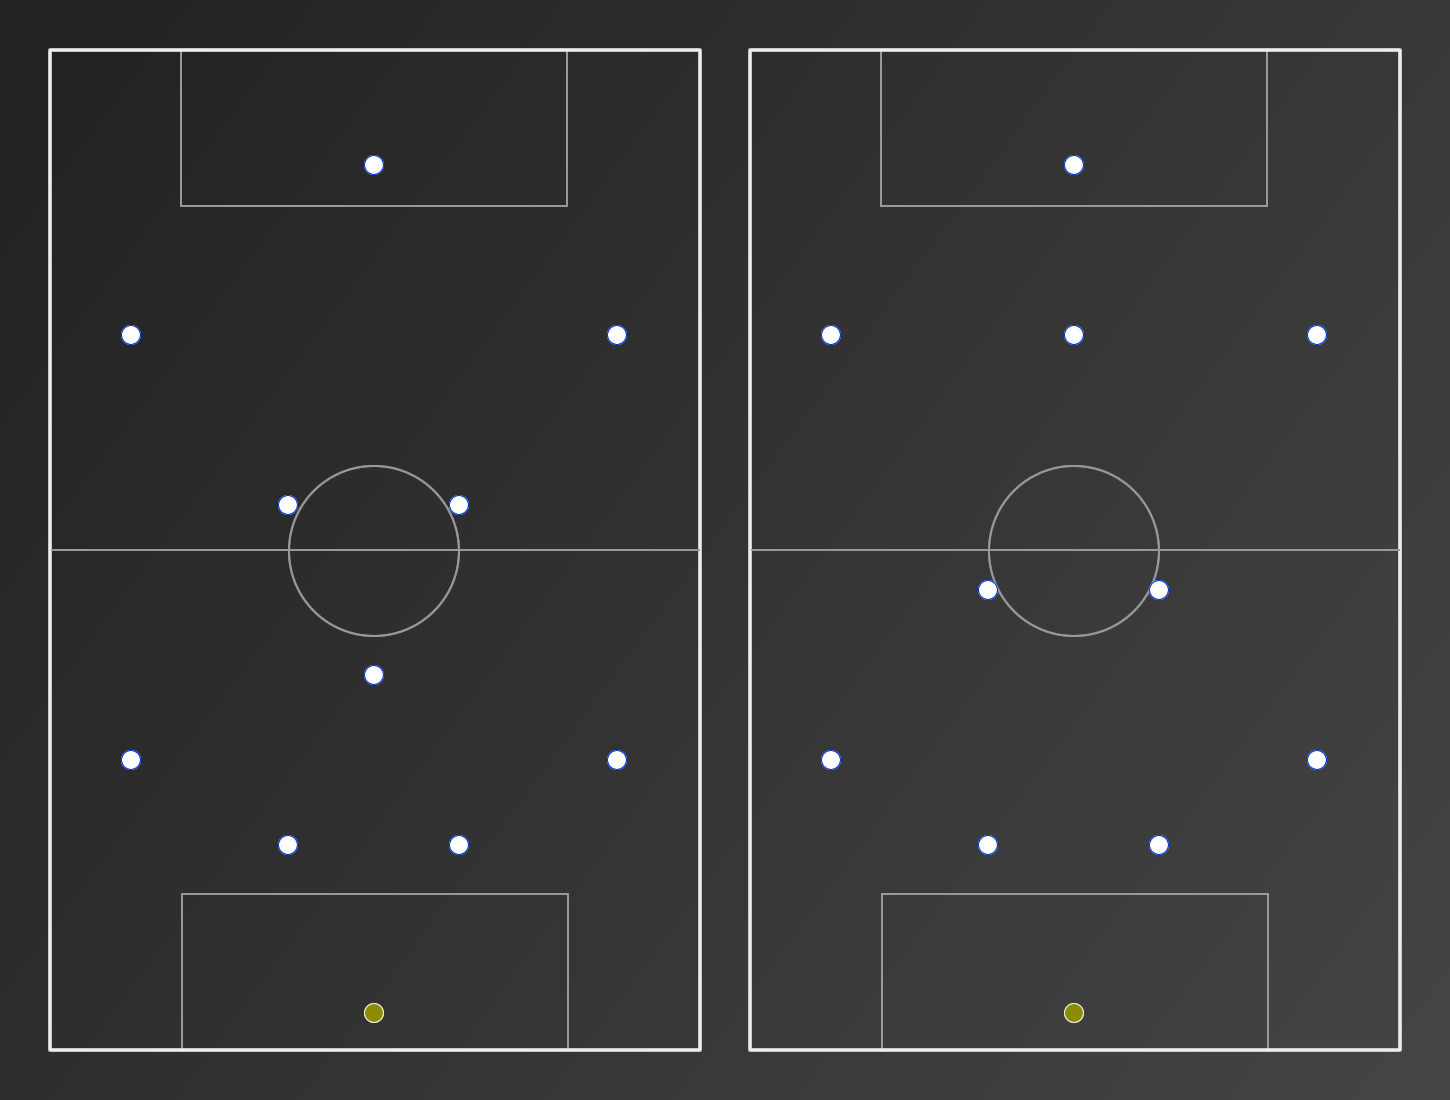
The two formations above are essentially the same, except for the configuration of the three central midfielders. Truth be told we have used versions of both formations at points during the season, and I think the double pivot 4231 gets much more out of our squad than the formation on the left. Before we get into the how’s and why’s, let us have another look at those expected goal results, this time split up by the midfield three selected.

433 (xGF: 5.7, xGA: 7.3, xGD: -1.6)

Adeyemi-Mowatt-Cook
Leeds 1.5 – 1.0 Burnley
Derby 0.9 – 0.9 Leeds
Leeds 1.2 – 1.6 Brentford
Middlesbrough 1.4 – 0.6 Leeds
Leeds 1.0 – 1.4 Brighton

Adeyemi-Murphy-Cook
Leeds 0.5 – 1.0 Ipswich

4231 (xGF: 6.9, xGA: 6.3, xGD: +0.6)

Cook-Murphy-Mowatt
MK Dons 2.2 – 1.6 Leeds
Leeds 1.3 – 0.8 Birmingham

Phillips-Adeyemi-Mowatt
Reading 0.7 – 0.9 Leeds

Phillips-Adeyemi-Antenucci
Bristol City 2.0 – 1.2 Leeds
Leeds 1.9 – 0.6 Sheffield Wednesday

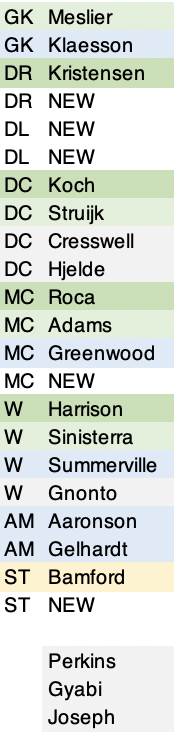
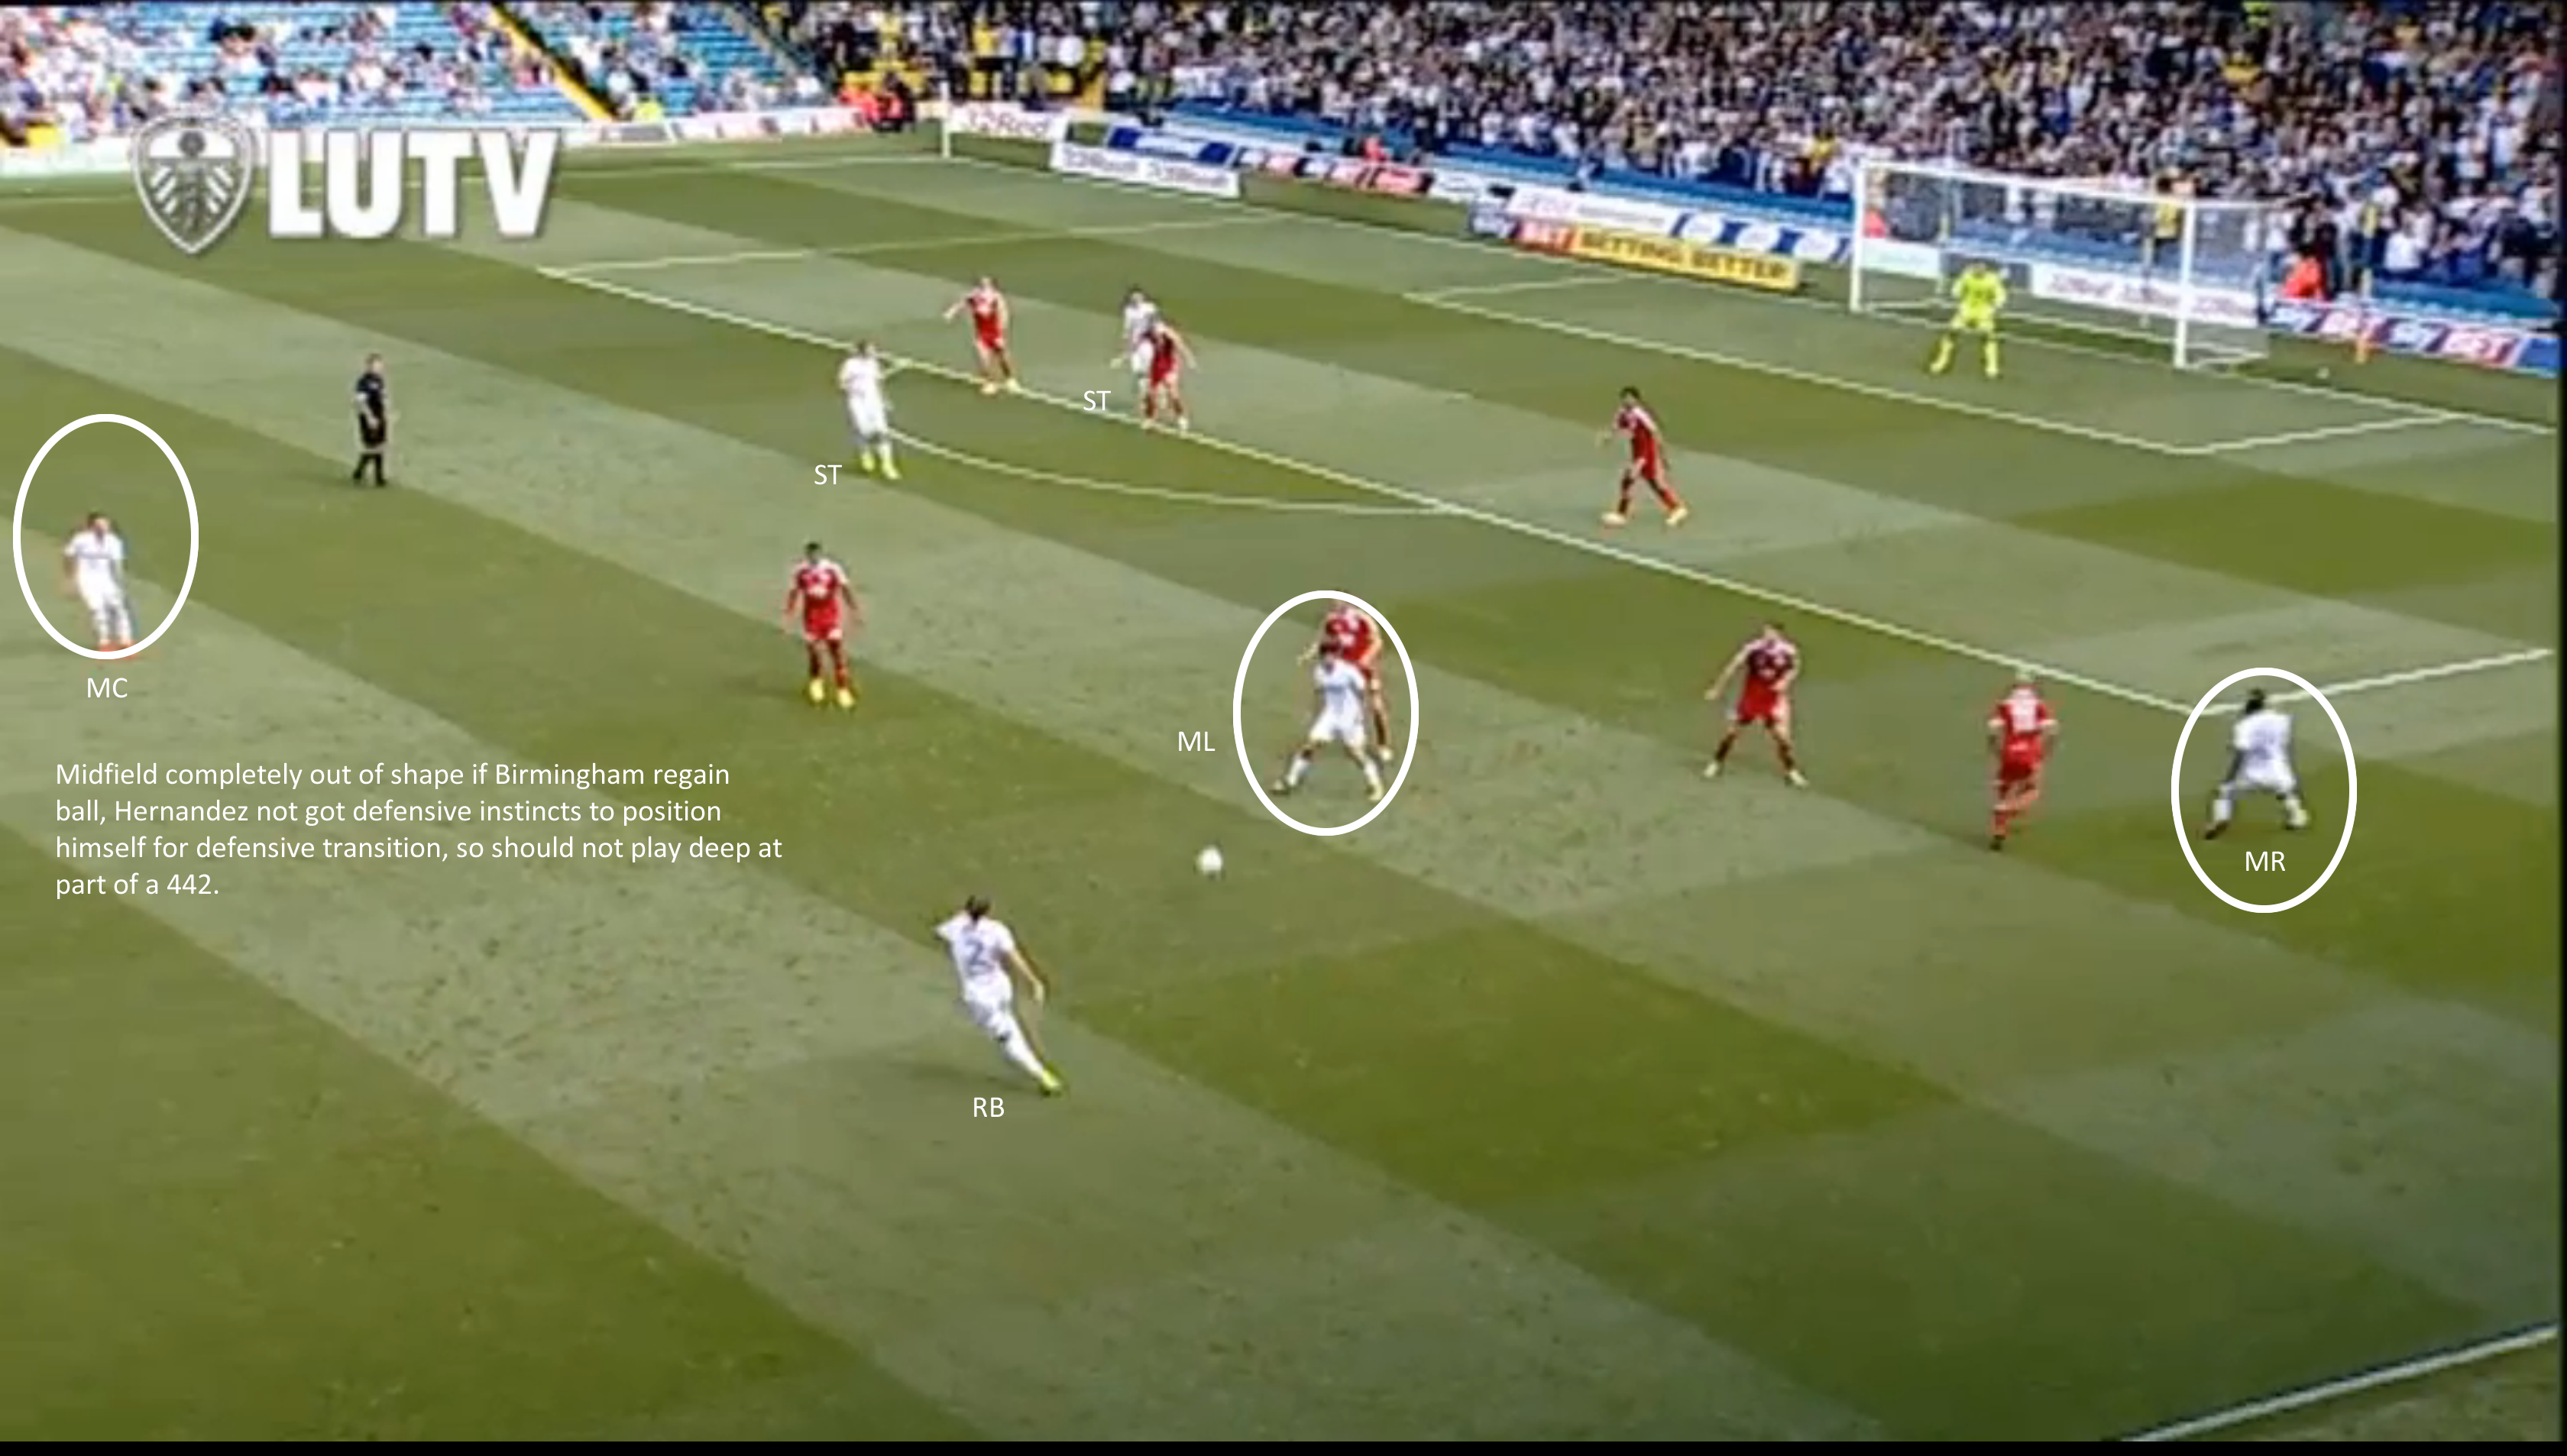
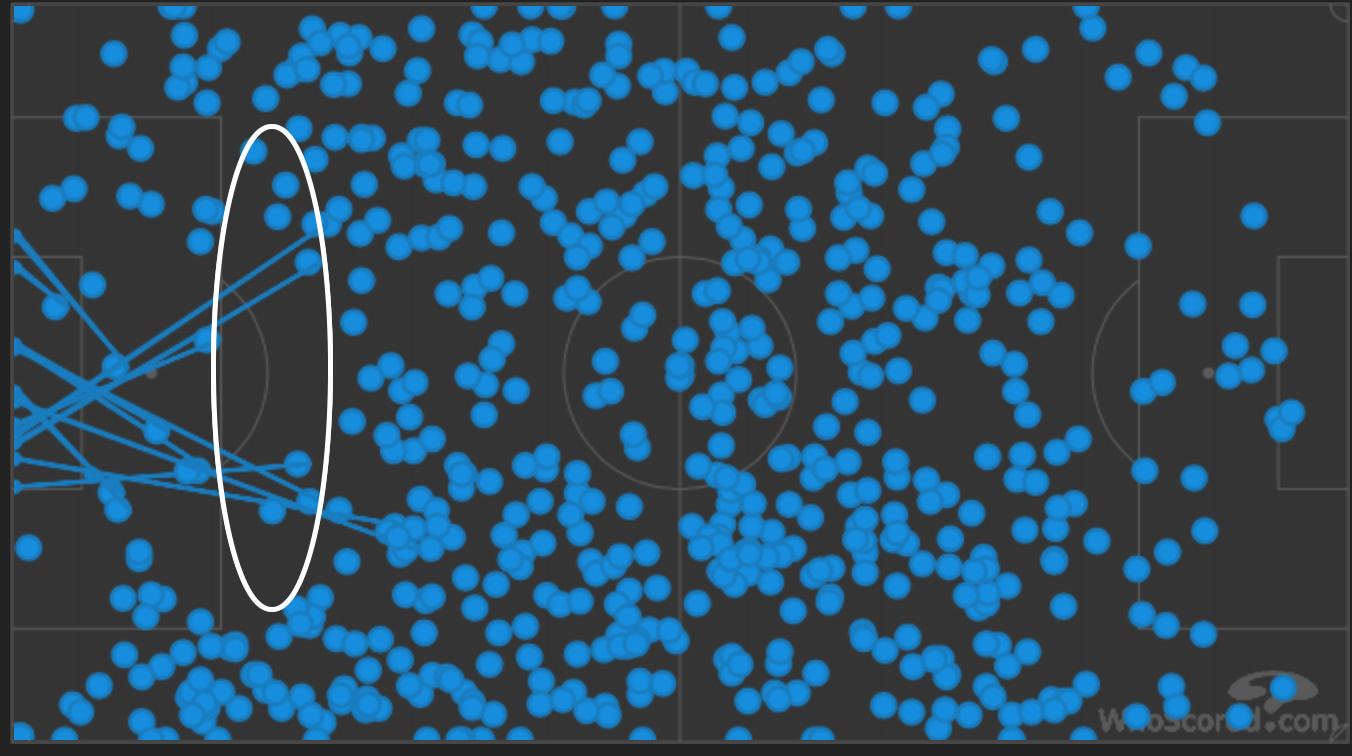
We can see from our admittedly small sample that we have played significantly better with the 4231 and I posit that the balance of the midfield has a lot to do with it. When playing the 433 formation, Adeyemi has been the preferred pivot, and he has been a successful disruptor so far this season, whilst Kalvin Phillips is an ample deputy. It is when picking the 2 in front that things start to get a little tricky. We have 3 configurations: Cook-Mowatt, Cook-Murphy and Murphy-Mowatt. Without the ball, Mowatt’s lack of defensive work means that we have a lop-sided midfield and Adeyemi gets dragged out of position to cover, leaving spaces for opposition midfield runners in behind. Going forward we miss out on the considerable talents of Alex Mowatt with the ball as he isn’t receiving the ball in locations further up the pitch. For an illustration of this then look no further than our most recent game against Brighton, where Mowatt made no tackles in comparison to Cook’s 5 and the knock-on impact it had on the team.

Tom Adeyemi’s lop-sided tackles map:

Screenshot 2015-10-20 01.28.28

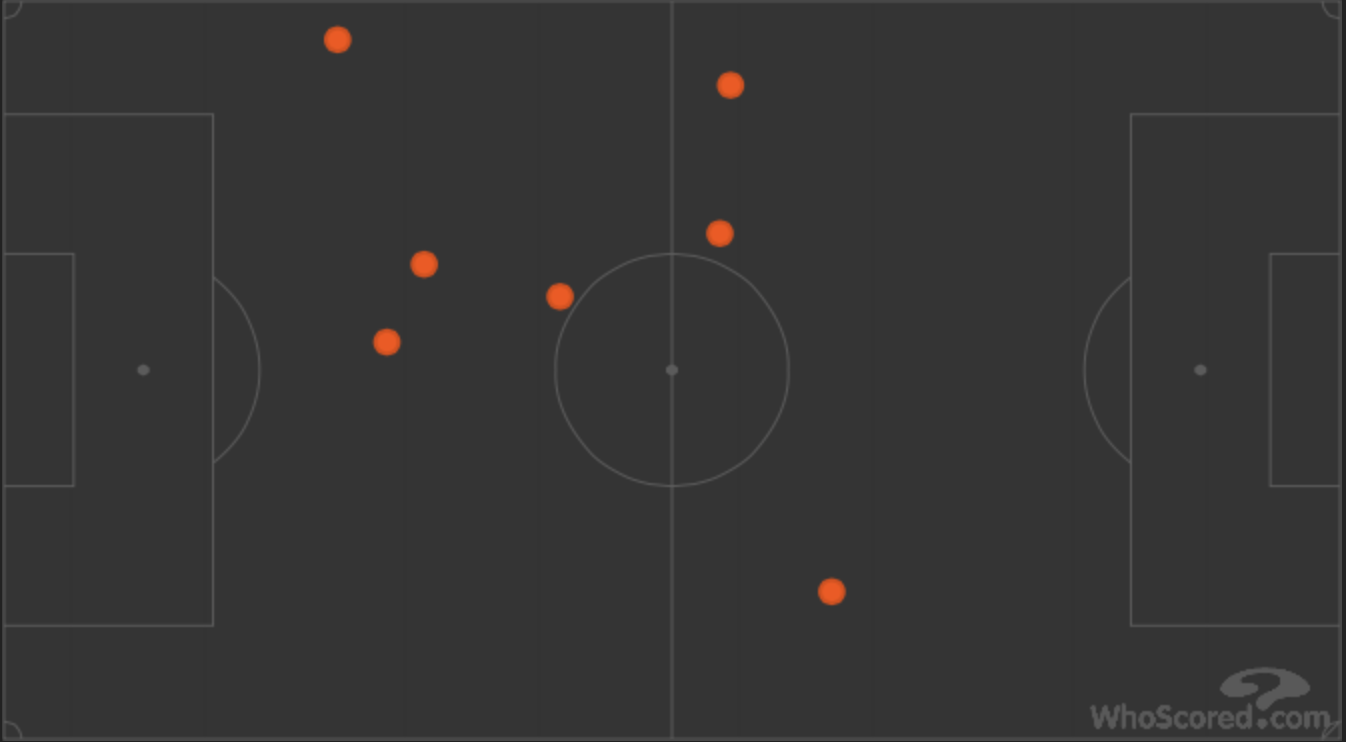
Alex Mowatt’s touch map:

Screenshot 2015-10-20 01.28.42

On Luke Murphy, he isn’t afforded the same time and space on the ball as when he plays deeper, meaning that he can’t utilise his range of passing, again hurting us going forward. So there isn’t really a satisfactory pairing to play in front of Adeyemi in the 433 formation.

This all changes when we consider the double pivot. The extra defensive midfielder frees the third player to play almost as a forward. This frees Alex Mowatt to do what he does best, create chances and score goals. Meanwhile, all of the other four central midfielders would be comfortable as part of the double pivot, these are the six possible configurations, from most to least defensive:

Adeyemi-Phillips (disruptor and defensive controller)
Adeyemi-Murphy (disruptor and deep-lying playmaker)
Adeyemi-Cook (disruptor and creative midfielder)
Murphy-Phillips (deep-lying playmaker and defensive controller)
Cook-Phillips (creative midfielder and defensive controller)
Cook-Murphy (creative midfielder and deep-lying playmaker)

Amongst all of them, there is a nice balance between defence and attack. The most defensive gives you the option to shut down the game or to go away to the better teams in the division, whilst Cook-Murphy means you sacrifice a little defensive stability for a lot of creativity. Both players are capable in defence and whilst neither would suit a single pivot role they can share the defensive work and succeed.

The 4231 solves a couple of other problems that the 433 just doesn’t. We have a very talented footballer in Mirco Antenucci, who has great technical skill and he’s rubbish in the air. He isn’t suited to playing as a lone striker and he’s not quick enough to be a winger. His ideal position, as with Alex Mowatt is at number 10 and his talent is being wasted. The lack of number 10 role in the team is also hurting Chris Wood, who has looked desperately isolated at times this season. With either Mowatt or Antenucci as a support player to link up the attack then Wood is able to hold up the ball better and bring team mates into the game.

All in all, Rosler didn’t have the time to flourish and he was certainly unlucky to be sacked. Who knows if the 4231 would have helped him to secure one or two results that would have bought him a few more weeks to mould his ideas onto the squad? I would suggest so.

Screenshot 2015-10-19 18.47.39.png